Frequently Asked Questions / FAQ
Foreword
In our manifesto, we talk about transparency. After commitments and words, here are the actions. On this page, you will find answers to your frequently asked questions, especially on the measurement/evaluation part.
How is the CO2 equivalent calculated for a content website?
Preliminary note
We are not a carbon impact audit and evaluation company (the thermometers). However, we need measurements to be able to improve the web and reduce the impact of content websites. Indeed, our added value at Webvert is to really reduce.
For this, we conduct an annual review of evaluation models and choose the best model or the least demanding one (the best thermometer). Our calculation method may therefore evolve every year.
If your diagnosis or decarbonization dates from before September 11, 2024, go to the section: (before 11/09/2023) - How is the CO2 equivalent calculated for a content website?.
Detail of our calculations of the CO2 equivalent for a content website
Following the latest state of the art, for calculating the CO2 equivalent for a content website, we rely on the Sustainable Web Design Model (v4) from the Green Web Foundation.
This is documented in this article: Understanding the latest Sustainable Web Design Model update (V4).
On Webvert’s side, we will only use the kWH aspect of the model.
The energy mix used is the average European energy mix of 2022: 277g of CO2 eq per kWh (Source: https://ember-climate.org/insights/research/global-electricity-review-2023/ ). The mix taken into account by Webvert between 2021 and September 2024 was 295g of CO2 eq per kWh.
The CO2 equivalent values displayed by Webvert are for 10,000 visits. This amounts to 3.14453 kWH/Mib for 10,000 visits.
|
Note
|
Mib = Mebibytes = 1024 x 1024 bytes |
What do you mean by digital waste?
We understand digital waste as elements that are emitted by servers, transmitted over the network, received by your terminal and that are neither visible to the user nor provide data to a marketing or communication team.
For a content website (corporate website, ecommerce, corporate blog, media site), the elements of waste we have identified are:
-
poorly configured browser cache on the hosting side,
-
poorly configured HTTP compression on the hosting side,
-
images and videos in an unsuitable format,
-
poorly sized images and videos,
-
unoptimized images,
-
non-minified CSS,
-
non-minified JavaScript.
Note that our approach is to preserve compatibility with older terminal models (mainly phones and tablets), the calculation of this waste does not take into account the comparison with formats like WebP. See our article on WebP.
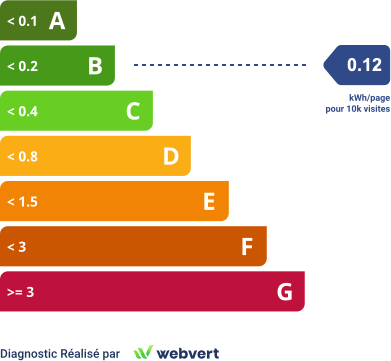
How is the scale of your Energy Performance Diagnostic for a content website determined?
Calculating the energy performance score of a content website
The score does not measure the total footprint of the site but the unnecessary bandwidth of the site for an equivalent rendering.
We have decided to iterate the measurement further by approaching the measurement mode of the EPD (Energy Performance Diagnostic) used for housing.
Indeed, measuring the total footprint of a site is like measuring the total size of the house. Spoiler: the larger the house, the more it pollutes. In our case, we measure the quality of the house’s insulation. That is, the unnecessary energy losses of the website rather than the size of its content.
For housing, the unit is kWhEP/m2 per year.
Our measure is kWh/page for 10,000 visits.
From this measure, like the EPD, a score is derived whose scale is based on the distribution of scores from 449 sites (2021).
How were the scale thresholds determined
The A to G scale was determined in 2021 on a sample of 449 measured sites.
Some points were determined by identifying thresholds of Page Speed score loss. The remaining points were determined through an exponential regression.
KWh/Page |
Average Page Speed Desktop |
Average Page Speed Mobile |
Point Determination |
0.0 - 0.1 |
91.19 |
61.09 |
Initial point |
0.1 - 0.2 |
83.57 |
49.02 |
First threshold of page speed/lighthouse score loss |
0.2 - 0.4 |
84.41 |
51.16 |
Exponential regression |
0.4 - 0.8 |
82.28 |
49.12 |
Exponential regression |
0.8 - 1.5 |
77.20 |
41.01 |
Second threshold of page speed/lighthouse score loss |
1.5 - 3.0 |
78.63 |
41.37 |
Exponential regression |
3.0 and more |
75.35 |
40.28 |
Third threshold of page speed/lighthouse score loss |
How is the equivalence in car travel mileage calculated?

Aren’t you afraid of generating a rebound effect?
In fact, the rebound effect has never been as present in web creation as it is today, all agencies, freelancers, independents, or students have the tools to buy aesthetic themes (but not optimized for conversion), to generate HD images or 4k videos. Generative AIs have even accentuated this phenomenon.
This is why websites designed around 2010 are often more sober and convert better than their redesigns from the late 2020s.
In reality, our decarbonization services are there to limit and counter this rebound effect. This also explains some results where we remove up to 70% of the website without altering its rendering.
Indeed, by wishing to avoid digital waste, our services erase the rebound effect linked to the ease of use of today’s creation tools.
Reminder: the rebound effect is the increase in consumption linked to the reduction of limits to the use of a technology Wikipedia Page
October 2003)
(before 11/09/2023) - How is the CO2 equivalent calculated for a content website?
The chosen model come from our 2021 to 2023 state of the art. The conclusions were as follows:
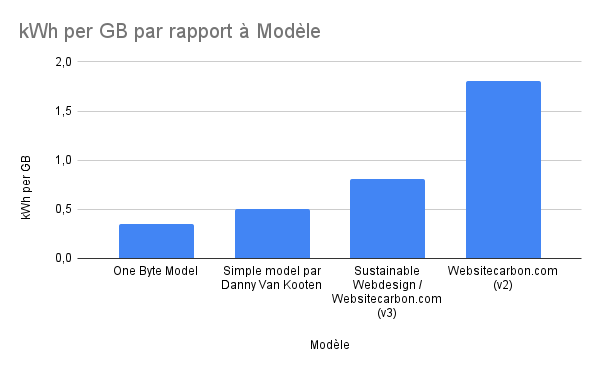
Since 2021, the choice has therefore been made for the One Byte Model from the Shift Project as it is the least demanding.
These models also have their limits, they are single criterion (only bandwidth).
Detail of our calculations of the CO2 equivalent for a content website
Our calculation of the CO2 equivalent was based on the conversion of bytes of bandwidth.
For this, we follow the approach of the Kaya equation.

We translate it as follows:
-
 : This is the energy mix. This is the role of electricity producers.
 -
 : This is the performance of infrastructures. This is the role of hosting and infrastructure operators.
 -
 : The bandwidth. This is where you act with Webvert. There needs to be sobriety in data volumes, without degrading the content! What factor is possible? This is our fight, our mission, to maximize it.

The energy mix is  , this is the European figure for the carbonization of electricity.
Most of our clients are in Europe. This is a lower assumption than that used by the Shift Project.
, this is the European figure for the carbonization of electricity.
Most of our clients are in Europe. This is a lower assumption than that used by the Shift Project.
The performance of the infrastructures are the figures from the Shift Project:
-
7.20E-11 in Kwh/byte is the energy impact of computing a byte in a data center.
-
1.52E-10 in Kwh/byte is the energy impact of transferring a byte across the network.
The performance of the infrastructures for a byte thus gives 
The bandwidth is calculated to be converted from mebibytes to bytes and for 10,000 full visits to your website. This gives: 
The calculation used is therefore as follows:

A more graphical version is available in the Ademe library: