The Digital Gaspilo-meter of the Exhibitors' Websites at the Green Tech Forum Brussels 2024 is Here!
We are pleased to present the ranking of the exhibitors' websites at the Green Tech Forum Brussels 2024, an exceptional first edition taking place this
year in Brussels after many successful years in Paris.
For this inaugural edition in Brussels, we audited the exhibitors' websites to measure their ecological performance, particularly their bandwidth waste,
a crucial aspect of the environmental impact of digital technology.
At Webvert, we are committed to minimizing bandwidth waste on websites, whether they have 20 or 200 pages. We invite you to test your website for free
with our self-diagnostic tool and then get support in decarbonizing your site. Our unique indicator reflects the current
ecological performance of each audited site, offering a different perspective from other CO2 impact audit SaaS.
We strongly encourage all exhibitors to continue their optimization efforts, both in terms of content and Google’s recommendations. Discover in this
article the detailed results of our audit and the ranking of the most efficient sites this year!
Let’s discover the ranking together!
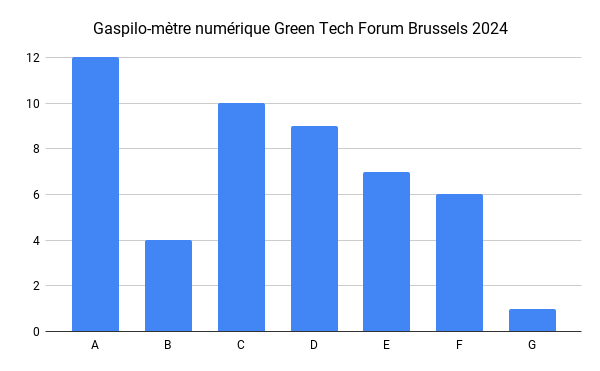
First, the graph for this year only:
In the first position, we have Bruxelles Formation, followed by ourselves, then Preo-ag which maintains an excellent position (they were first in the 2023 ranking in Paris!), then we discover Ecologic-re and finally TheShifters. Well done to you, your sites do not waste bandwidth!
🥇 Bruxelles Formation
🥈 Webvert
🥉 Preo-ag
Ecologic-re
TheShifters
Now, let’s compare with the previous years of the Green Tech Forum:
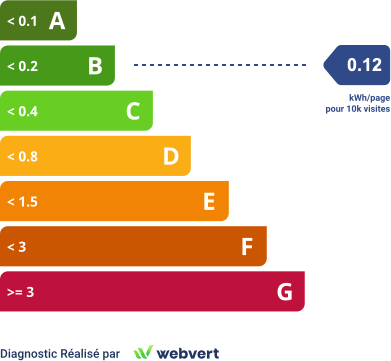
image::/blog/images/2024-06-18/Gaspilo-mètre-gtf-comparaison.png["Distribution by score from A to G of the sites with a comparison between 2021, 2022, 2023,
and 2024",600,371]
The evolution of the exhibitors' rankings over the years is represented in the graph above.
This graph shows the distribution of the exhibitors' websites according to their scores, from A to G, for the years 2021, 2022, 2023, and 2024.
The graph reveals a significant decrease in the number of sites rated in category A, from 51.72% in 2021 to 17.54% in 2024, while the intermediate categories
B, C, and D have seen a notable increase, suggesting a general but incomplete optimization of ecological performance.
The lower categories E, F, and G show a growing or stable presence, indicating that some sites still require major improvements.
Overall, although progress is visible, it remains essential to continue efforts to improve the ecological efficiency of websites in general. These results
indicate a trend towards more homogeneous optimization, even if the majority of energy efficiency efforts still need to be maintained and improved.
This measures all the public pages of the website (not just the homepage).
The calculated emissions are not the total footprint of the website but the unnecessary footprint, which usually comes from a lack of knowledge of eco-design principles.
If you want to calculate the total footprint of the website, you can use ecoindex from GreenIT.
The lower the score, the better (the lower the unnecessary ecological impact).
Sites prefixed with
have undergone a Webvert Revision service.
Analyses are limited to 99 pages (usually 200, the number has been reduced due to the volume of exhibitors).
Calculating the Energy Performance Score of a Website
The score does not measure the total footprint of the site but the unnecessary bandwidth for an equivalent rendering.
Indeed, the total footprint measurement of a site, as done by ecoindex, is like measuring the total size of a house.
Spoiler: the larger the house, the more it pollutes.
In our context, we measure the quality of the house’s insulation, i.e., the unnecessary energy losses of the website rather than the size of its content.
For housing, the unit is kWhEP/m² per year.
Our measurement is kWh/page for 10,000 visits.
From this measurement, as with the DPE, we derive a score whose scale is based on the distribution of scores from 600 sites (to this day).
In summary, if you are in A or B, thank you! Beyond that, a little revision is necessary!