State of the art and limit of measuring the footprint of a content website - Version 2023
Rédigé le 06/09/2023 par Youen Chéné
Why this state of the art of content websites?
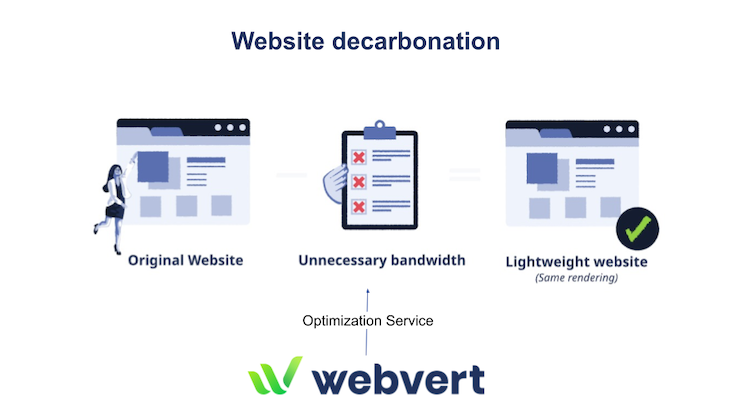
At Webvert, we provide services to reduce bandwidth on content websites. Indeed, on a content website, the main variable is the bandwidth delivered to our website visitors (this is not necessarily the case for management applications or SaaS applications).
Our work is:
-
to identify and measure unnecessary bandwidth,
-
to remove this unnecessary bandwidth,
-
to measure the progress and communicate it to the client.
Even though we are not a measurement or evaluation vendor, part of our job is to accurately identify and measure environmental impacts in order to provide reliable data to our clients.
While we have the technical data, transitioning from technical data to environmental data is not yet a standard practice. Therefore, every year, we conduct a state of the art evaluation of measuring content websites. Last year’s can be found here: Web Measurement State of the Art - 2021-2022.
Here is the one for 2023:
Scope: Why content websites?
Behind "website," it is easy to include different types of digital services. We will distinguish:
-
Content websites (showcase site, blog, e-commerce, media - excluding streaming).
-
Application websites (management application, SaaS software).
-
Websites that are an overlay of a specialized system (e.g., ChatGPT, Google Search, Netflix).
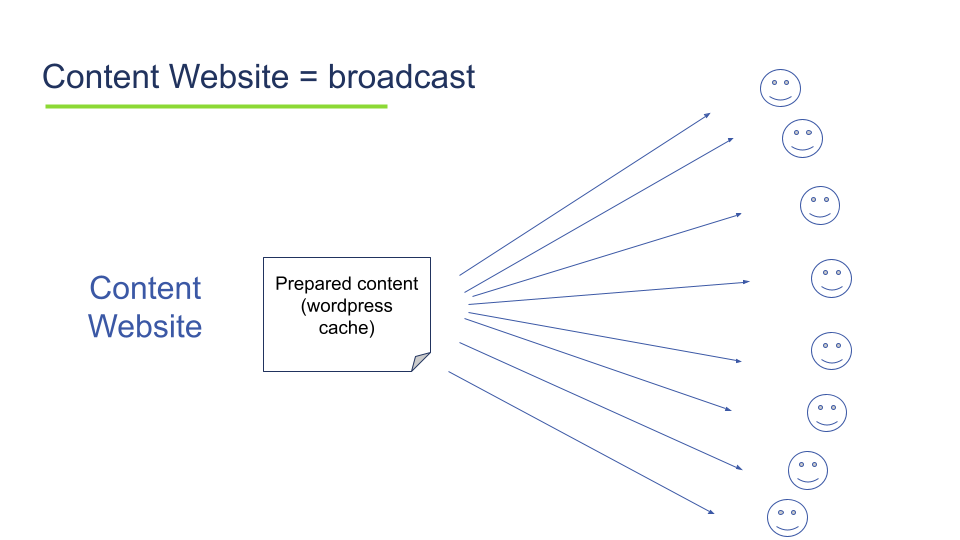
Content websites are characterized by having bandwidth as the main variable: the content that is sent to be viewed by visitors.
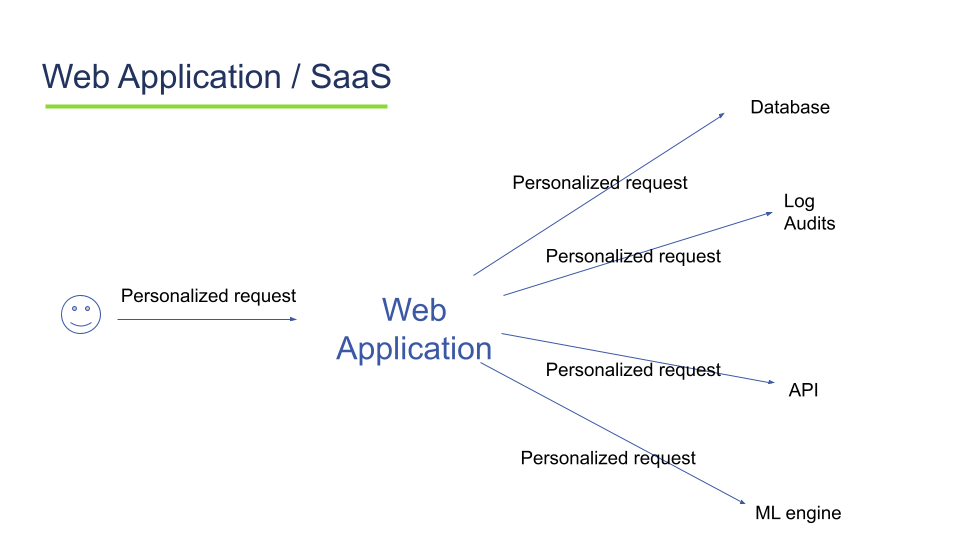
Application websites and specialized overlays will have a more moderate use of bandwidth but a more significant use of memory and processors.
This state of the art pertains only to content websites.
Reminder of the types of evaluation of content website footprints
In the web or simply in physics, there are 2 types of evaluation:
-
Modeling
-
Real measurement with evaluation tools.
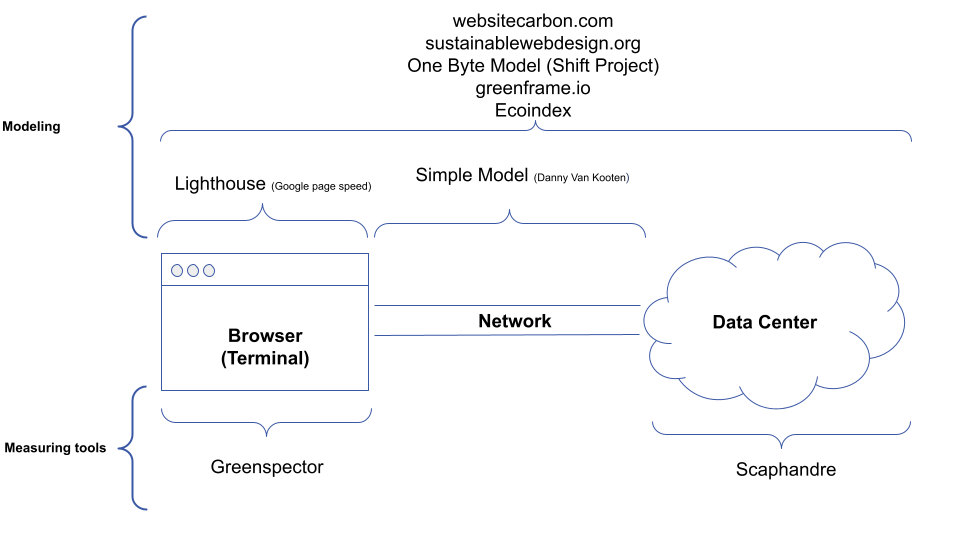
Real measurement is the most precise but has a setup cost and is difficult to implement on hundreds of pages (even tens). It will be more suitable for web applications (management, SaaS) or any other type of computing workload/processing type.
Modeling will be used for known and more uniform types of computing processes like content websites. It is less complicated to implement and can be used on a large scale (hundreds, thousands, or tens of thousands of web pages).
The challenge is to choose the right type of evaluation to assess the right type of computing process:
-
For example, using Ecoindex or the 1 byte model on a web application is not a good idea and a bad practice.
-
Just as using scaphandre or greenspector for a content site targeting only a few pages is not very useful.
This state of the art pertains only to modeling evaluations.
Details of the state of the art of measuring a content website
Considered models for the state of the art
The models considered for the state of the art are as follows.
Open models
-
EcoIndex (2014)
-
One Byte Model (2021)
-
Simple Model (VanKooten) (2020)
-
Websitecarbon.com (v2) (2020)
-
Sustainable Webdesign / Websitecarbon.com (v3) (2020)
-
CO2.js (2020-2023)
Note that CO2.js is a wrapper/encapsulator of One Byte Model and Sustainable Design.
Ecoindex will not be considered due to its equation and the difficulty of comparing it to other models.
Indeed, its equation is as follows:
async def get_greenhouse_gases_emmission(ecoindex: float) -> float:
    return round(100 * (2 + 2 * (50 - ecoindex) / 100)) / 100
It starts from the Ecoindex score and can only vary between 1kg of CO2 eq and 3kg of CO2 eq.
Closed models
-
Greenmetrics (2022)
-
Fruggr (2021)
-
Greenoco (2022)
-
Digital Beacon (2020)
Note that the models of Fruggr, Greenoco, and Digital Beacon will not be considered. Their documentation may indicate some of the parameters involved, but none provide the model’s equation.
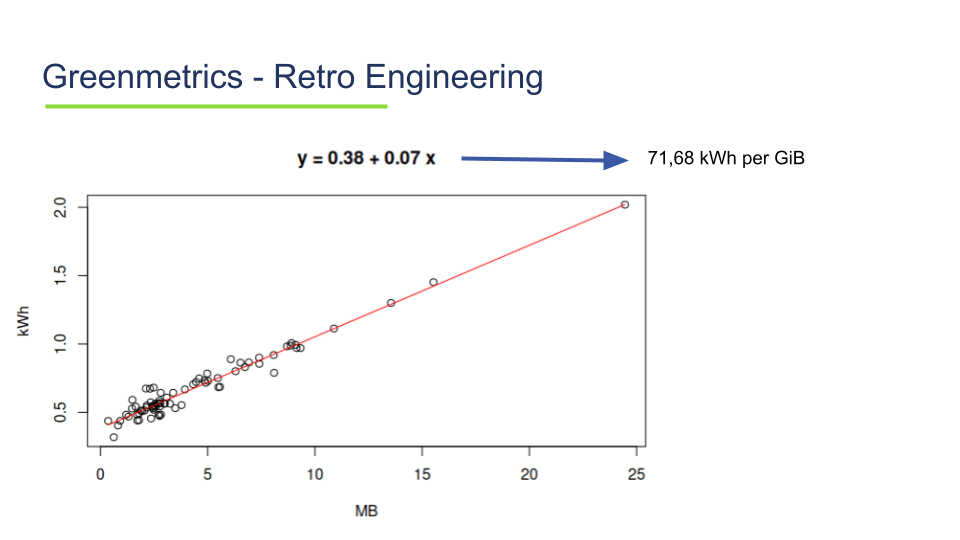
For Greenmetrics, we will determine an approach to their model through linear regression.
Models based on a server plan
Other models are based on a server plan:
-
Greenframe (2021)
-
Ecolab (2023)
These models are not suitable for content models but more for web applications and other more complex processes.
Indeed, in 99% of content web cases, we are in hypermutualized infrastructure models with a small percentage of server usage on database servers or web servers.
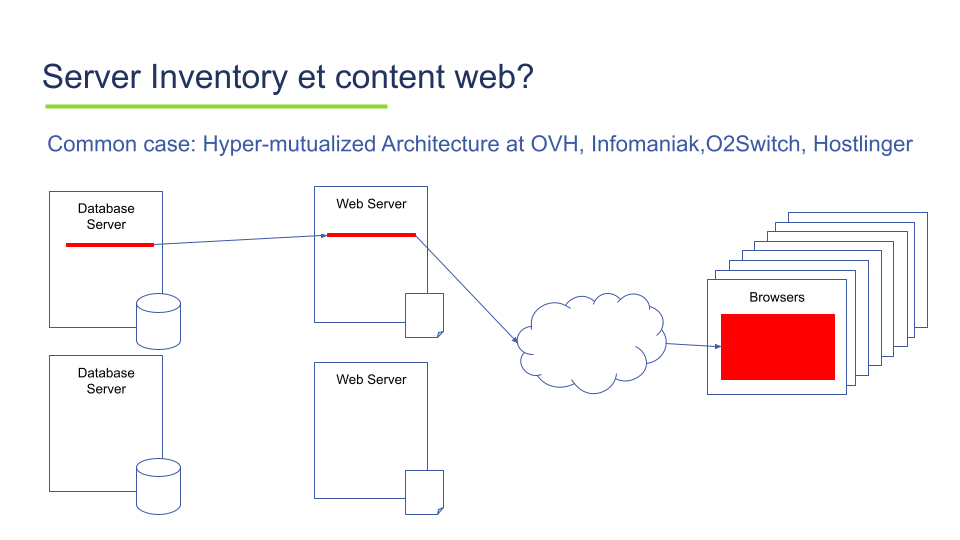
This state of the art will not consider this type of models.
Comprehensive and summary view of evaluation models
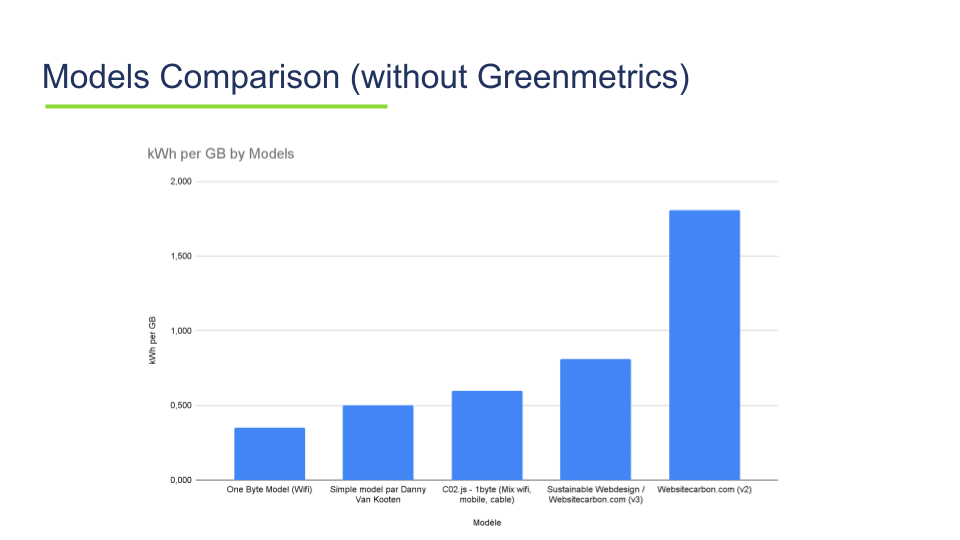
Taking the selected models, we obtain the following comparison based on the Kilowatt Hour conversion factor of bandwidth, the primary characteristic of a content website.
Model |
kWh per GiO (GibioOctet) |
One Byte Model (Wifi) |
0.350 |
Simple model by Danny Van Kooten |
0.500 |
C02.js - 1byte (Mix wifi, mobile, cable) |
0.600 |
Sustainable Webdesign / Websitecarbon.com (v3) |
0.810 |
Websitecarbon.com (v2) |
1.805 |
Greenmetrics |
71.680 |
The Greenmetric model is not in the same order of magnitude as the other models. Here is the graph that provides a better comparison between the most used models. It will also be seen in the limitations of the current model of the majority of models.
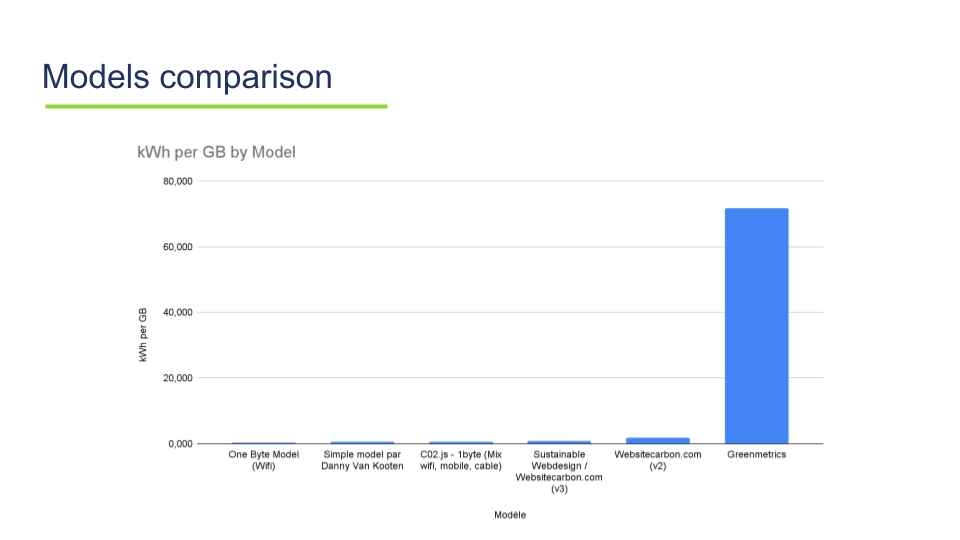
It is noted:
-
The new version of Websitecarbon is less promising by halving the first model.
-
The greenmetrics model, or rather our post-regression linear model of it, is outside the scope of the other models.
-
The CO2.js model, the model you will find behind many free evaluation sites, has 2 options: Website Carbon V3 or the One byte model from the Shift project.
-
In fact, very little evolution since the state of the art 2021-2022.
What choice for Webvert?
As mentioned at the beginning of the article, the goal of this state of the art is to select the best measure to showcase the results of our website optimization work.
Our choice remains the same as the previous year. Indeed, we stick to the lowest kWh per GigaOctet, which is the 1 byte model from the Shift Project in wifi version.
Details of the evaluation models
Here is the summary table of information on all models.
| Name | Scope | Year of appearance | Equation | Parameters considered | Links |
|---|---|---|---|---|---|
Simple model by Danny Van Kooten |
Network |
2020 |
0.5 kWh per GB |
Bandwidth |
|
Whole Grain / websitecarbon.com (v2) |
Browser Network Data Center |
2020 |
1.805 kWh per GB. |
Bandwidth |
|
Sustainable Webdesign / Websitecarbon.com(v3) |
Browser Network Data Center |
2022 |
0.81 kWh per GB |
Bandwidth |
|
One Byte Model (Shift project) |
Browser Network Data Center |
2021 |
0.24 kWh per GB + 0.11 Wh per minute. |
Bandwidth Consultation time |
|
CO2.JS |
Browser Network Data Center |
2020 |
Same as One Byte Model and Sustainable Web Design Optional |
Bandwidth Consultation time Energy Mix |
|
Greenframe |
Network Data Center |
2020 |
CPU RAM Bandwidth |
||
Greenoco |
Browser Network Data Center |
2022 |
Non Public |
Real traffic on the website Number of requests Bandwidth Energy Mix Data Center PUE |
|
Fruggr |
Browser Network Data Center |
2021 |
Non Public |
"Real traffic on the website (GA) Bandwidth Energy Mix" |
|
EcoIndex |
Browser Network Data Center Manufacturing |
2014 |
Bandwidth DOM size Number of requests |
||
Digital Beacon |
Browser Network Data Center |
2020 |
Non Public |
Bandwidth Energy Mix |
The limits of the state of the art of content websites
The main point is that these models (excluding Ecoindex) are single-criteria. This criterion is bandwidth, which is indeed the main characteristic of a content site, but for example, in material behavior modeling in engineering school, we already do polynomial modeling in introductory practical work.
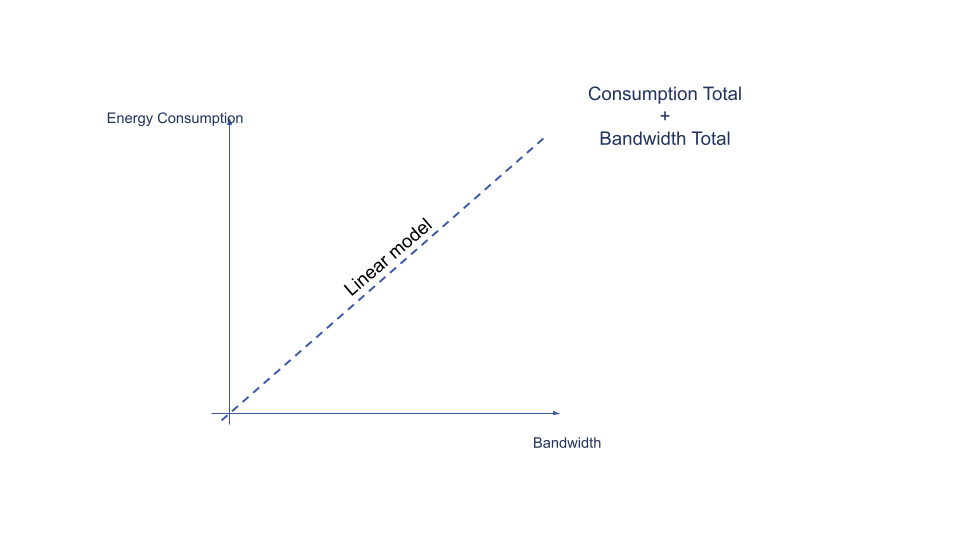
These linear models are generally based on 2 data points:
-
The total annual energy consumption of the internet.
-
The total annual internet traffic (bandwidth).
For example, the Sustainable Web Design/WebsiteCarbon V3 model and thus CO2.js, the most used model, are based on 2 figures:
-
Annual Internet Energy: 1988 TWh
-
Annual End User Traffic: 2444 EB
This results in: Annual Internet Energy / Annual End User Traffic = 0.81 tWh/EB or 0.81 kWh/GB
This can be considered a fragile foundation in terms of modeling; the internet is a constellation of different types of computing processes, from WordPress to blockchain to YouTube or your accounting batches for managing transfers or payrolls. Moreover, the figures used are often dated from the reference study of 2018 (Ericsson/Jens Malmodin/Dag Lundén study).
In the meantime, computing has seen a concentration of data centers at major cloud providers, a significant increase in usage with COVID, and an improvement in hardware efficiency.
If we focus solely on content websites, we can say that it is more complex than that.
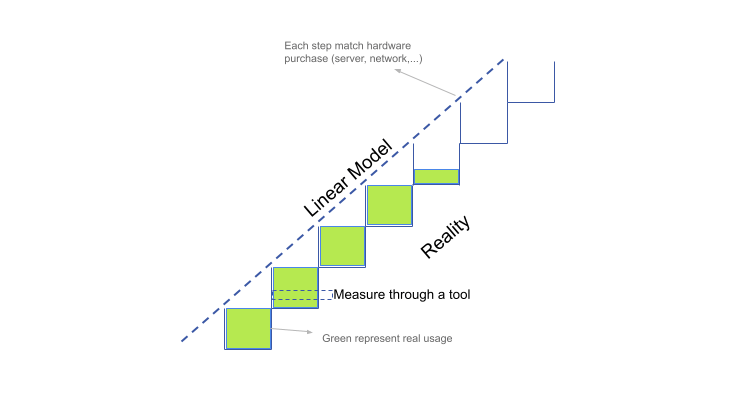
While these models remain the closest to the likely behavior of a content website, a word of caution: they should not be used for other types of computing processes (SaaS applications, etc.).
The only multi-criteria model is the grandfather of models, Ecoindex, which will soon have a dedicated article on this blog. The limit of this model is that it is not a CO2 impact estimation model but a rating index on which awareness of water and CO2 emissions has been added.
How to improve the state of the art of content websites
As mentioned, current models have their limitations; they are linear, single-criteria, and based on questionable and dated assumptions. Nevertheless, for content websites, they are the most suitable. The challenge is that in this favorable context, there is an opportunity to greatly advance the state of the art on this subject.
For this, at Webvert we would like to fund a thesis, to share the results within the association Boavizta, but for this thesis to advance the state of the art, it needs to be based on massive datasets. The datasets of a major content website provider such as OVH, Infomaniak, O2Switch, or Hostlinger. If you are part of one of these companies, do not hesitate to contact us to advance this state of the art and better assess the digital impact: contact-these (at) lewebvert.fr .